Automating Repetitive
Reports with
2025 MAPOR Fall Webinar Series
Introduction

Overview
Automating Repetitive Reports with Quarto
Overview
What is Quarto?
Getting started
Iterating your reports
Styling your reports
Rendering other formats
Summary
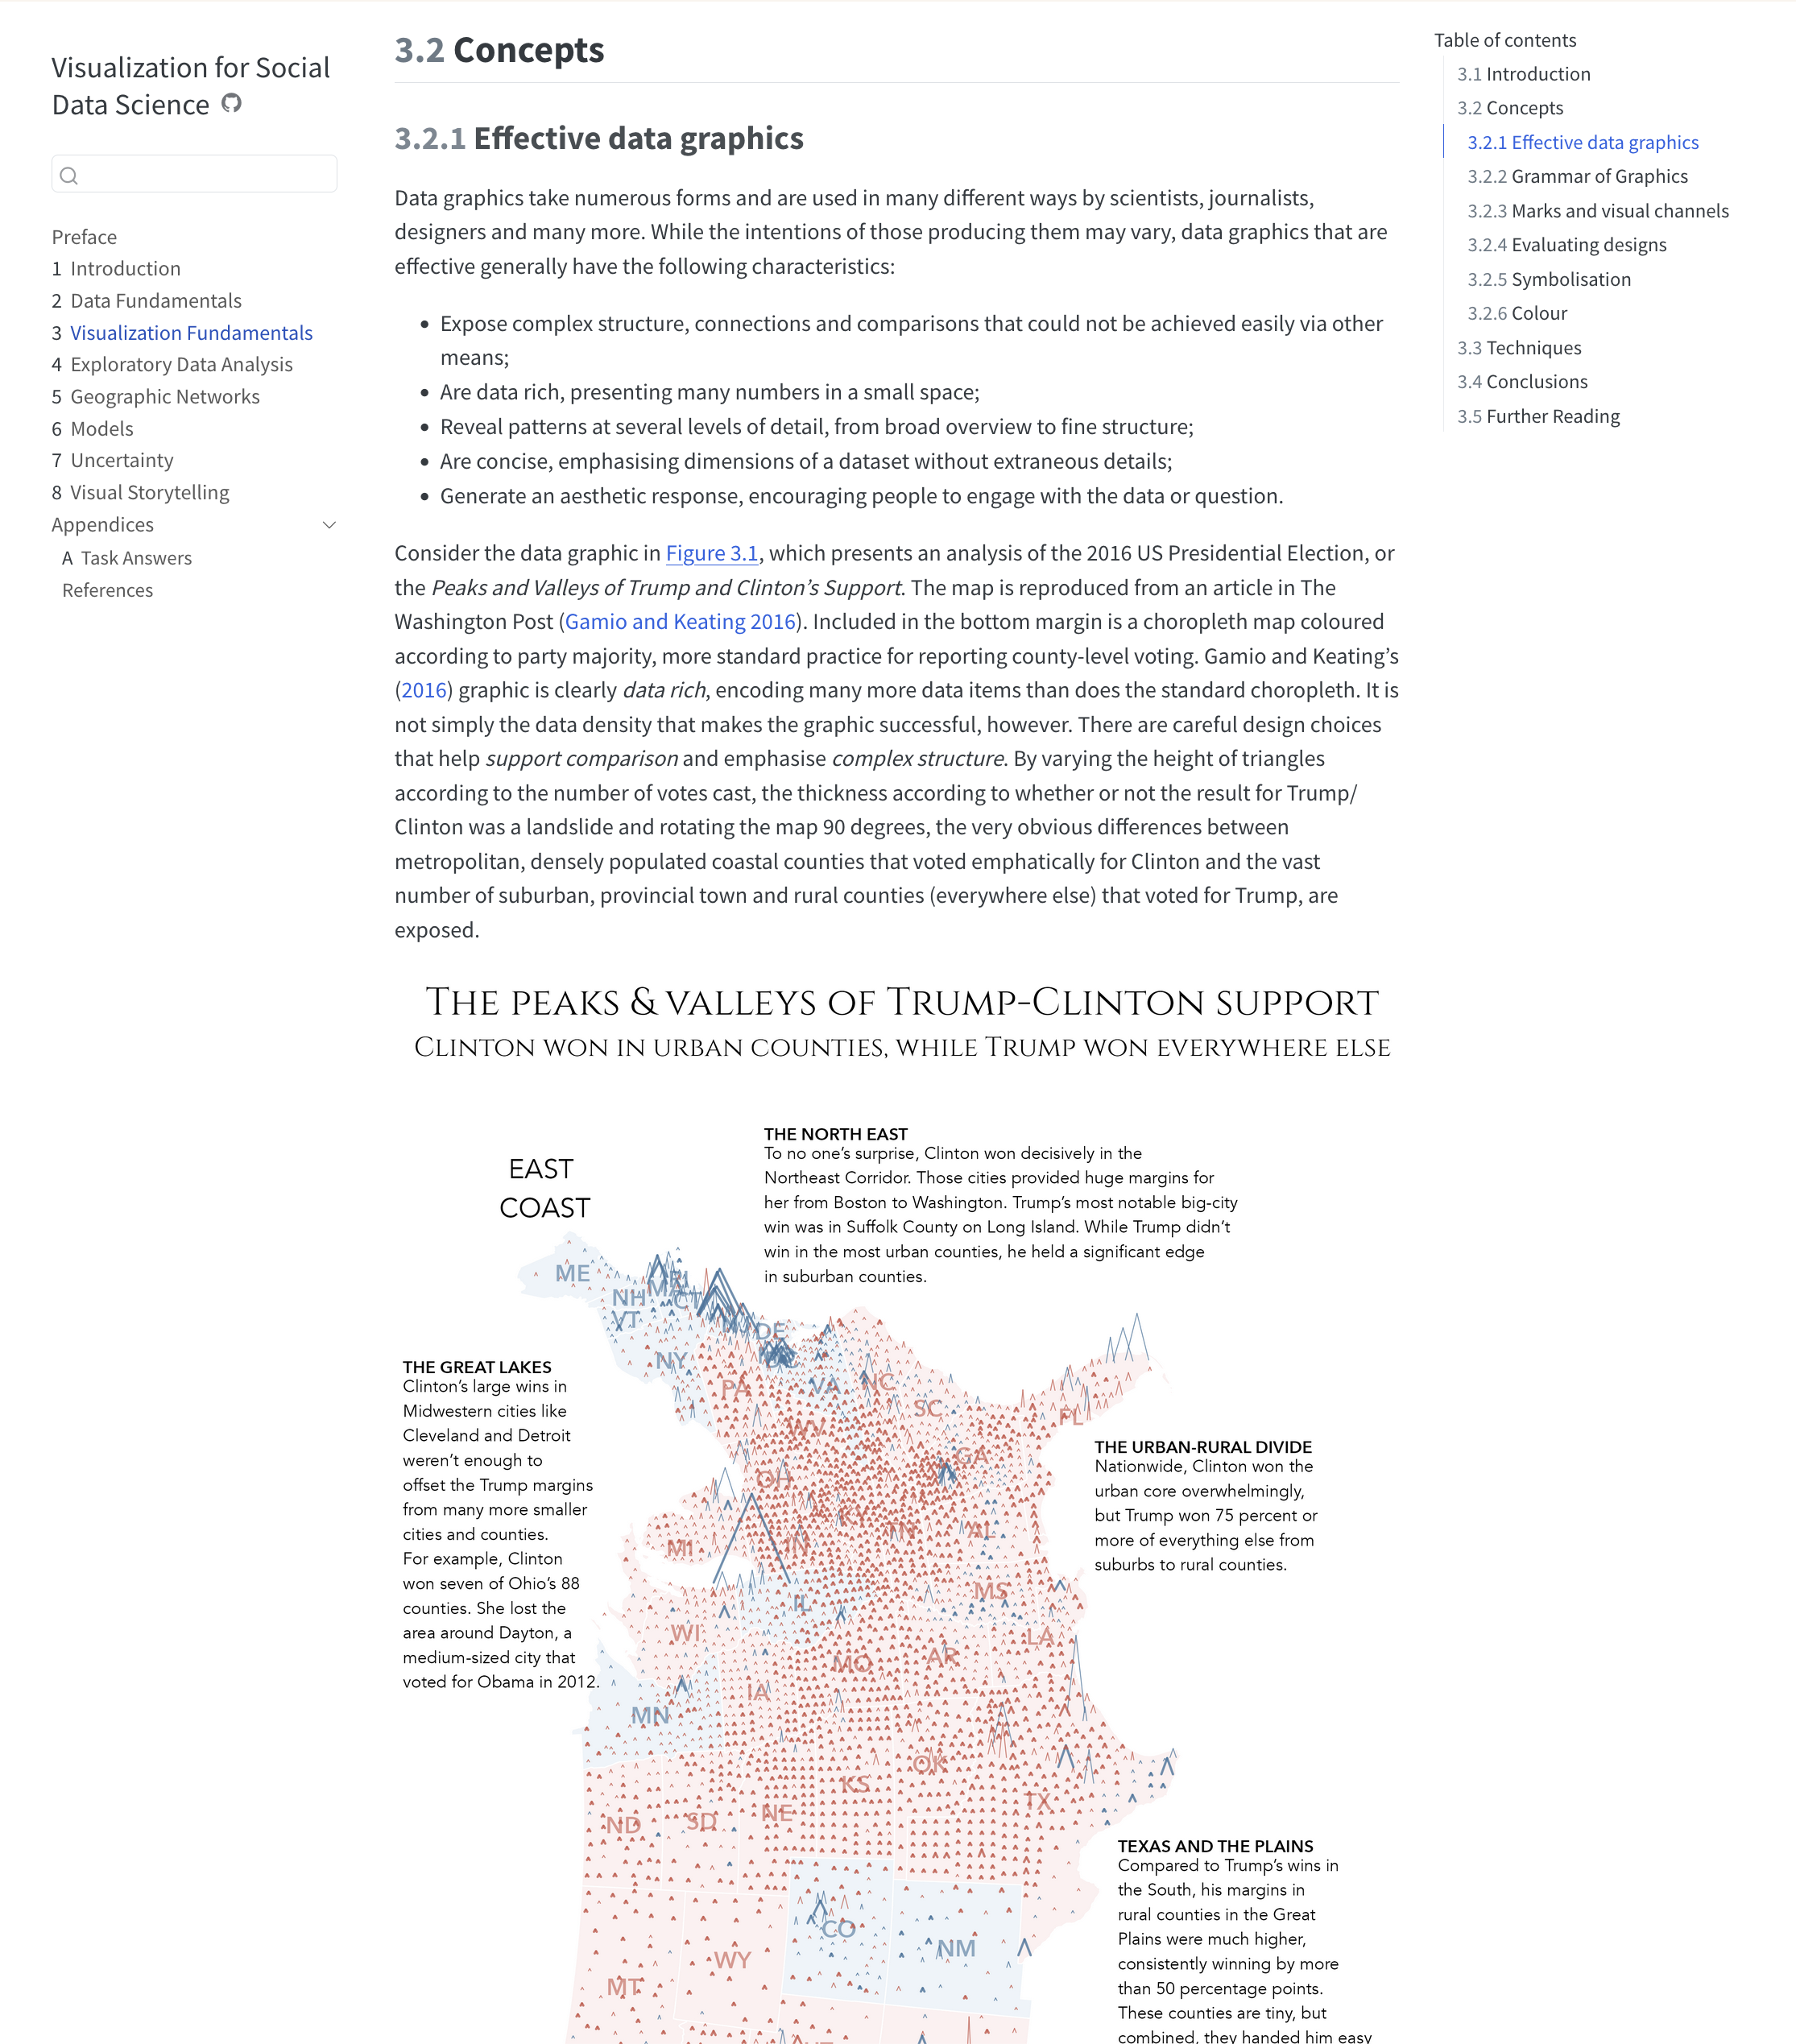
The challenge
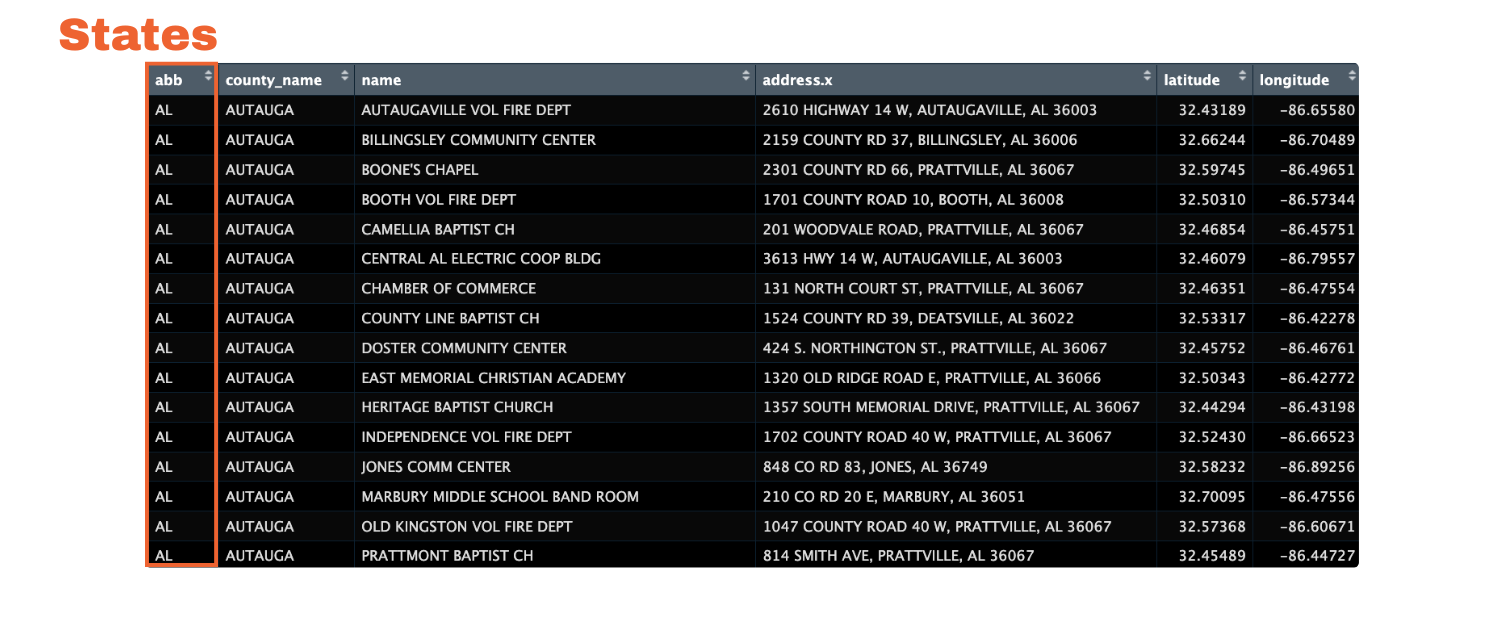
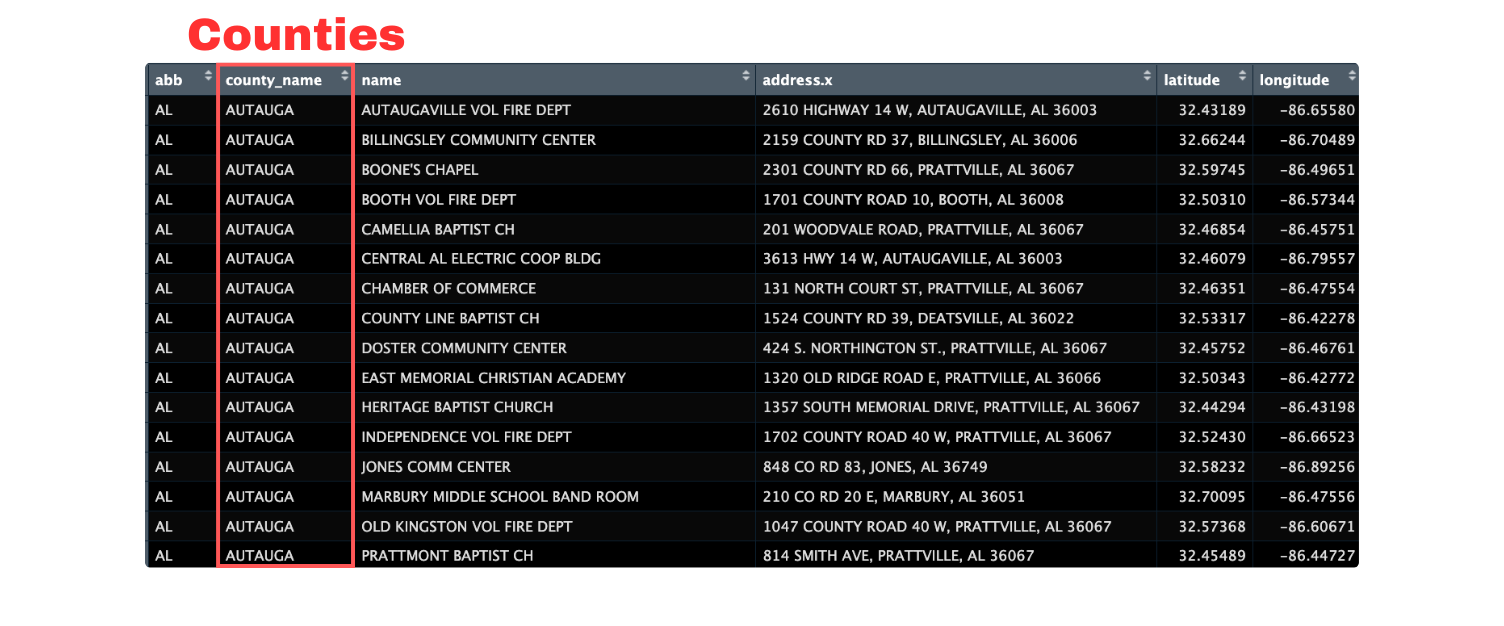
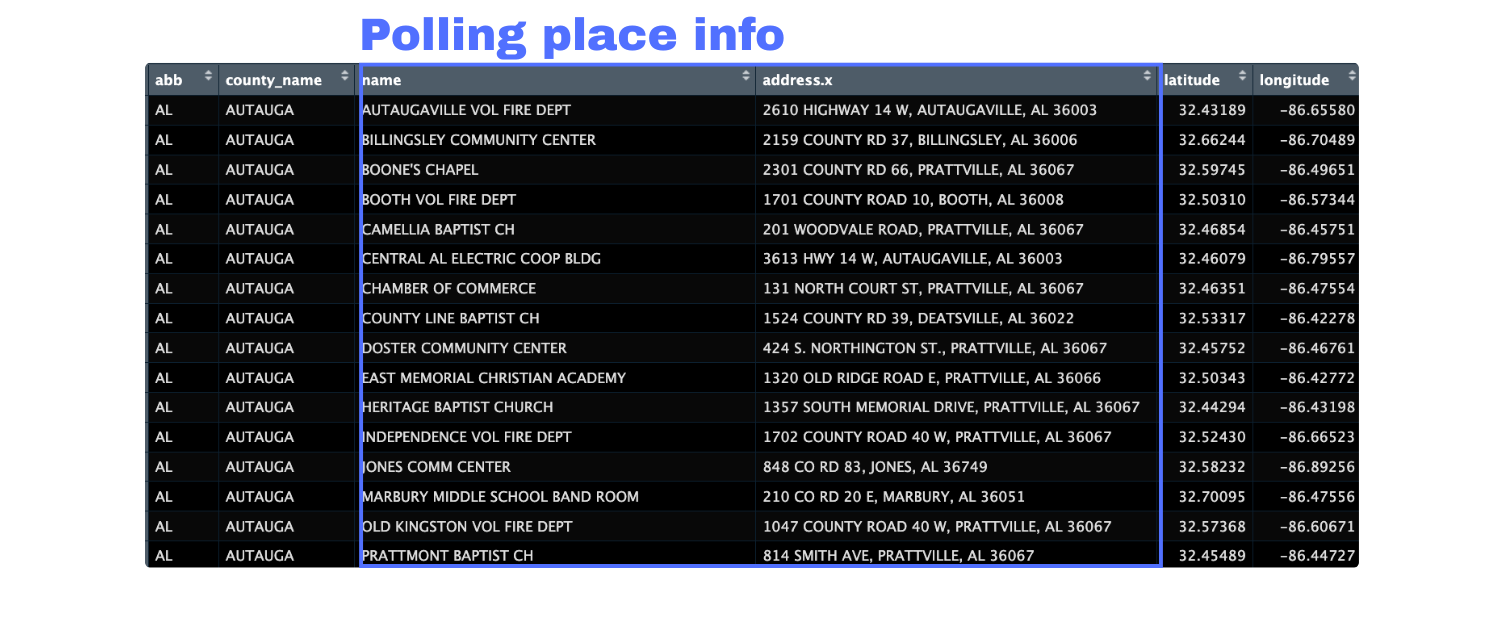
We will be using data from TidyTuesday on polling places in the United States.
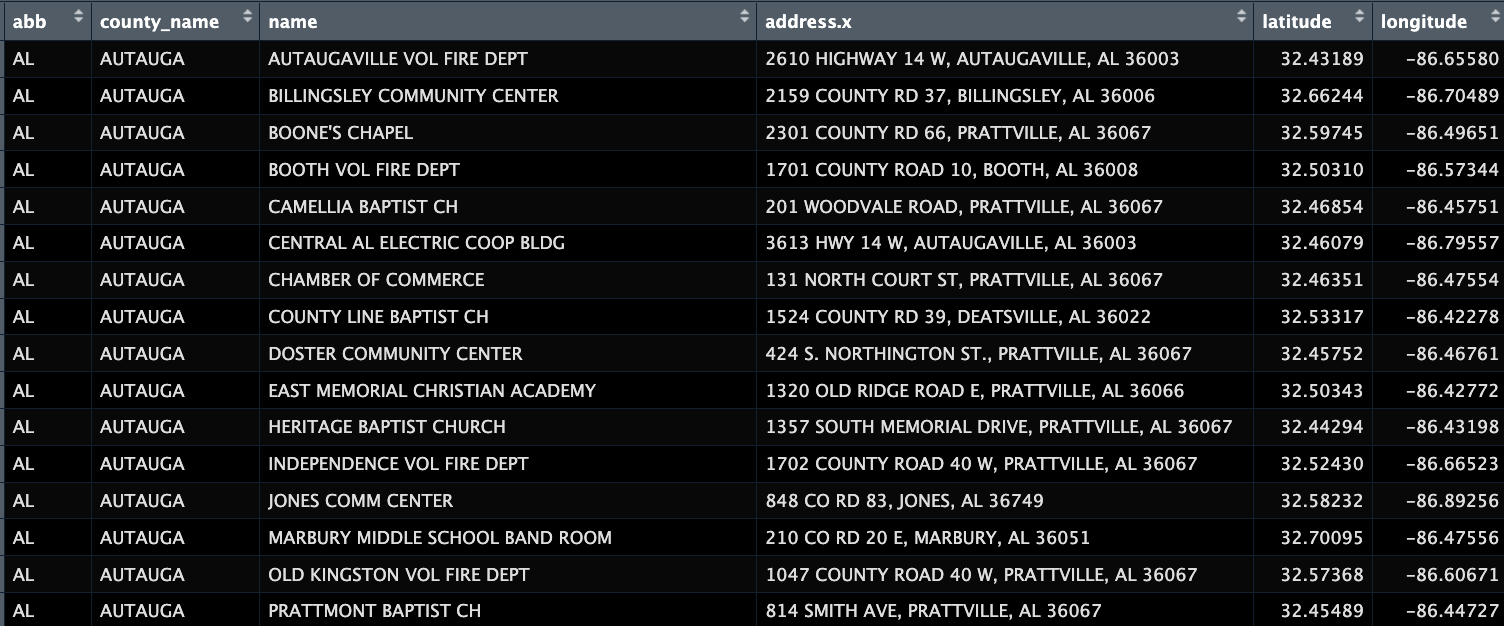
Geocoded by @thedivtagguy
The challenge
The challenge
The challenge
The challenge
The challenge
The challenge
How to do this without…
- Copy and pasting?
- Manually editing changes?
- Giving up?

The solution
Session materials
- Slides: https://ivelasq-automating-quarto.share.connect.posit.cloud
- GitHub repo with templates: https://github.com/ivelasq/reports-with-quarto-exercises
Note
We will be using R code.
What is Quarto?
Automating Repetitive Reports with Quarto
Overview
What is Quarto?
Getting started
Iterating your reports
Styling your reports
Rendering other formats
Summary
What is Quarto?
Quarto is an open-source scientific and technical publishing system that allows you to combine text, images, code, plots, and tables in a fully-reproducible document. Quarto has support for multiple languages including R, Python, Julia, and Observable. It also works for a range of output formats such as PDFs, HTML documents, websites, presentations.
Definition by Nicola Rennie
How does Quarto work?
Artwork from “Hello, Quarto” keynote by Julia Lowndes and Mine Çetinkaya-Rundel, presented at RStudio::Conf(2022). Illustrated by Allison Horst.
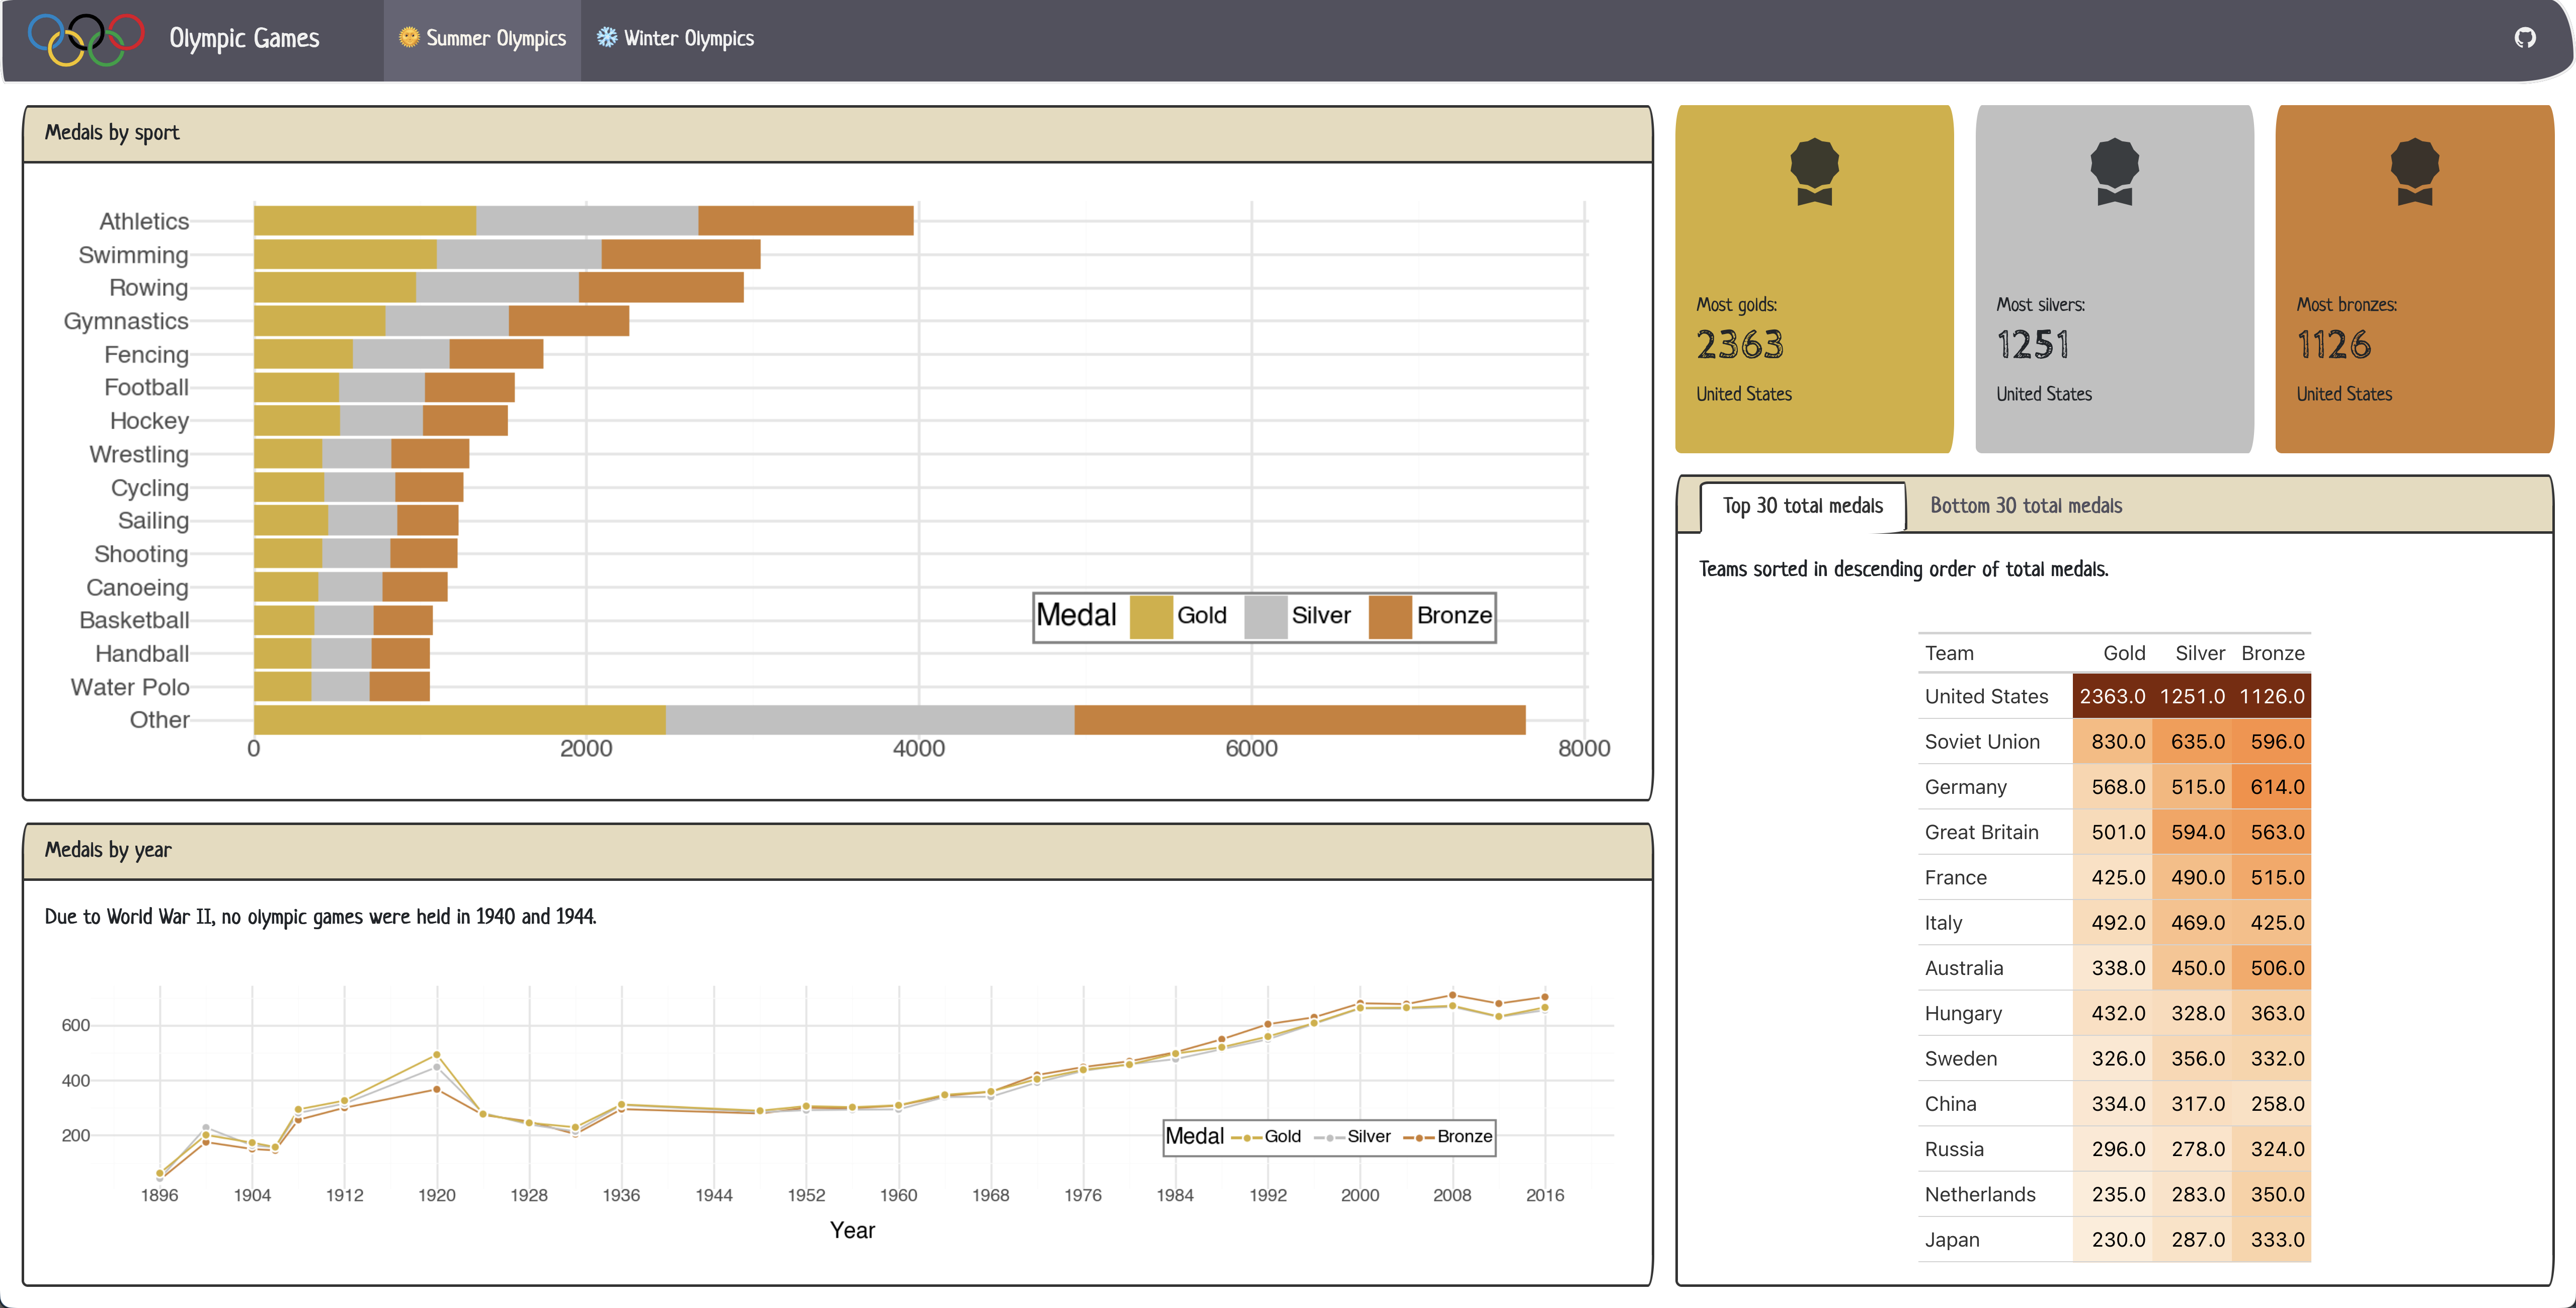
What can you build with Quarto?
Why Quarto?
- Reproducibility: Document your process and make it easy to reproduce and replicate your work
- Automation: Update your report and/or code output
- Flexibility: Add multiple data sources, create figures, tables, diagrams, etc.
- Single-source publishing: Ability to create HTML, PDF, Word versions from a single source
Getting started
Automating Repetitive Reports with Quarto
Overview
What is Quarto?
Getting started
Iterating your reports
Styling your reports
Rendering other formats
Summary
Installation
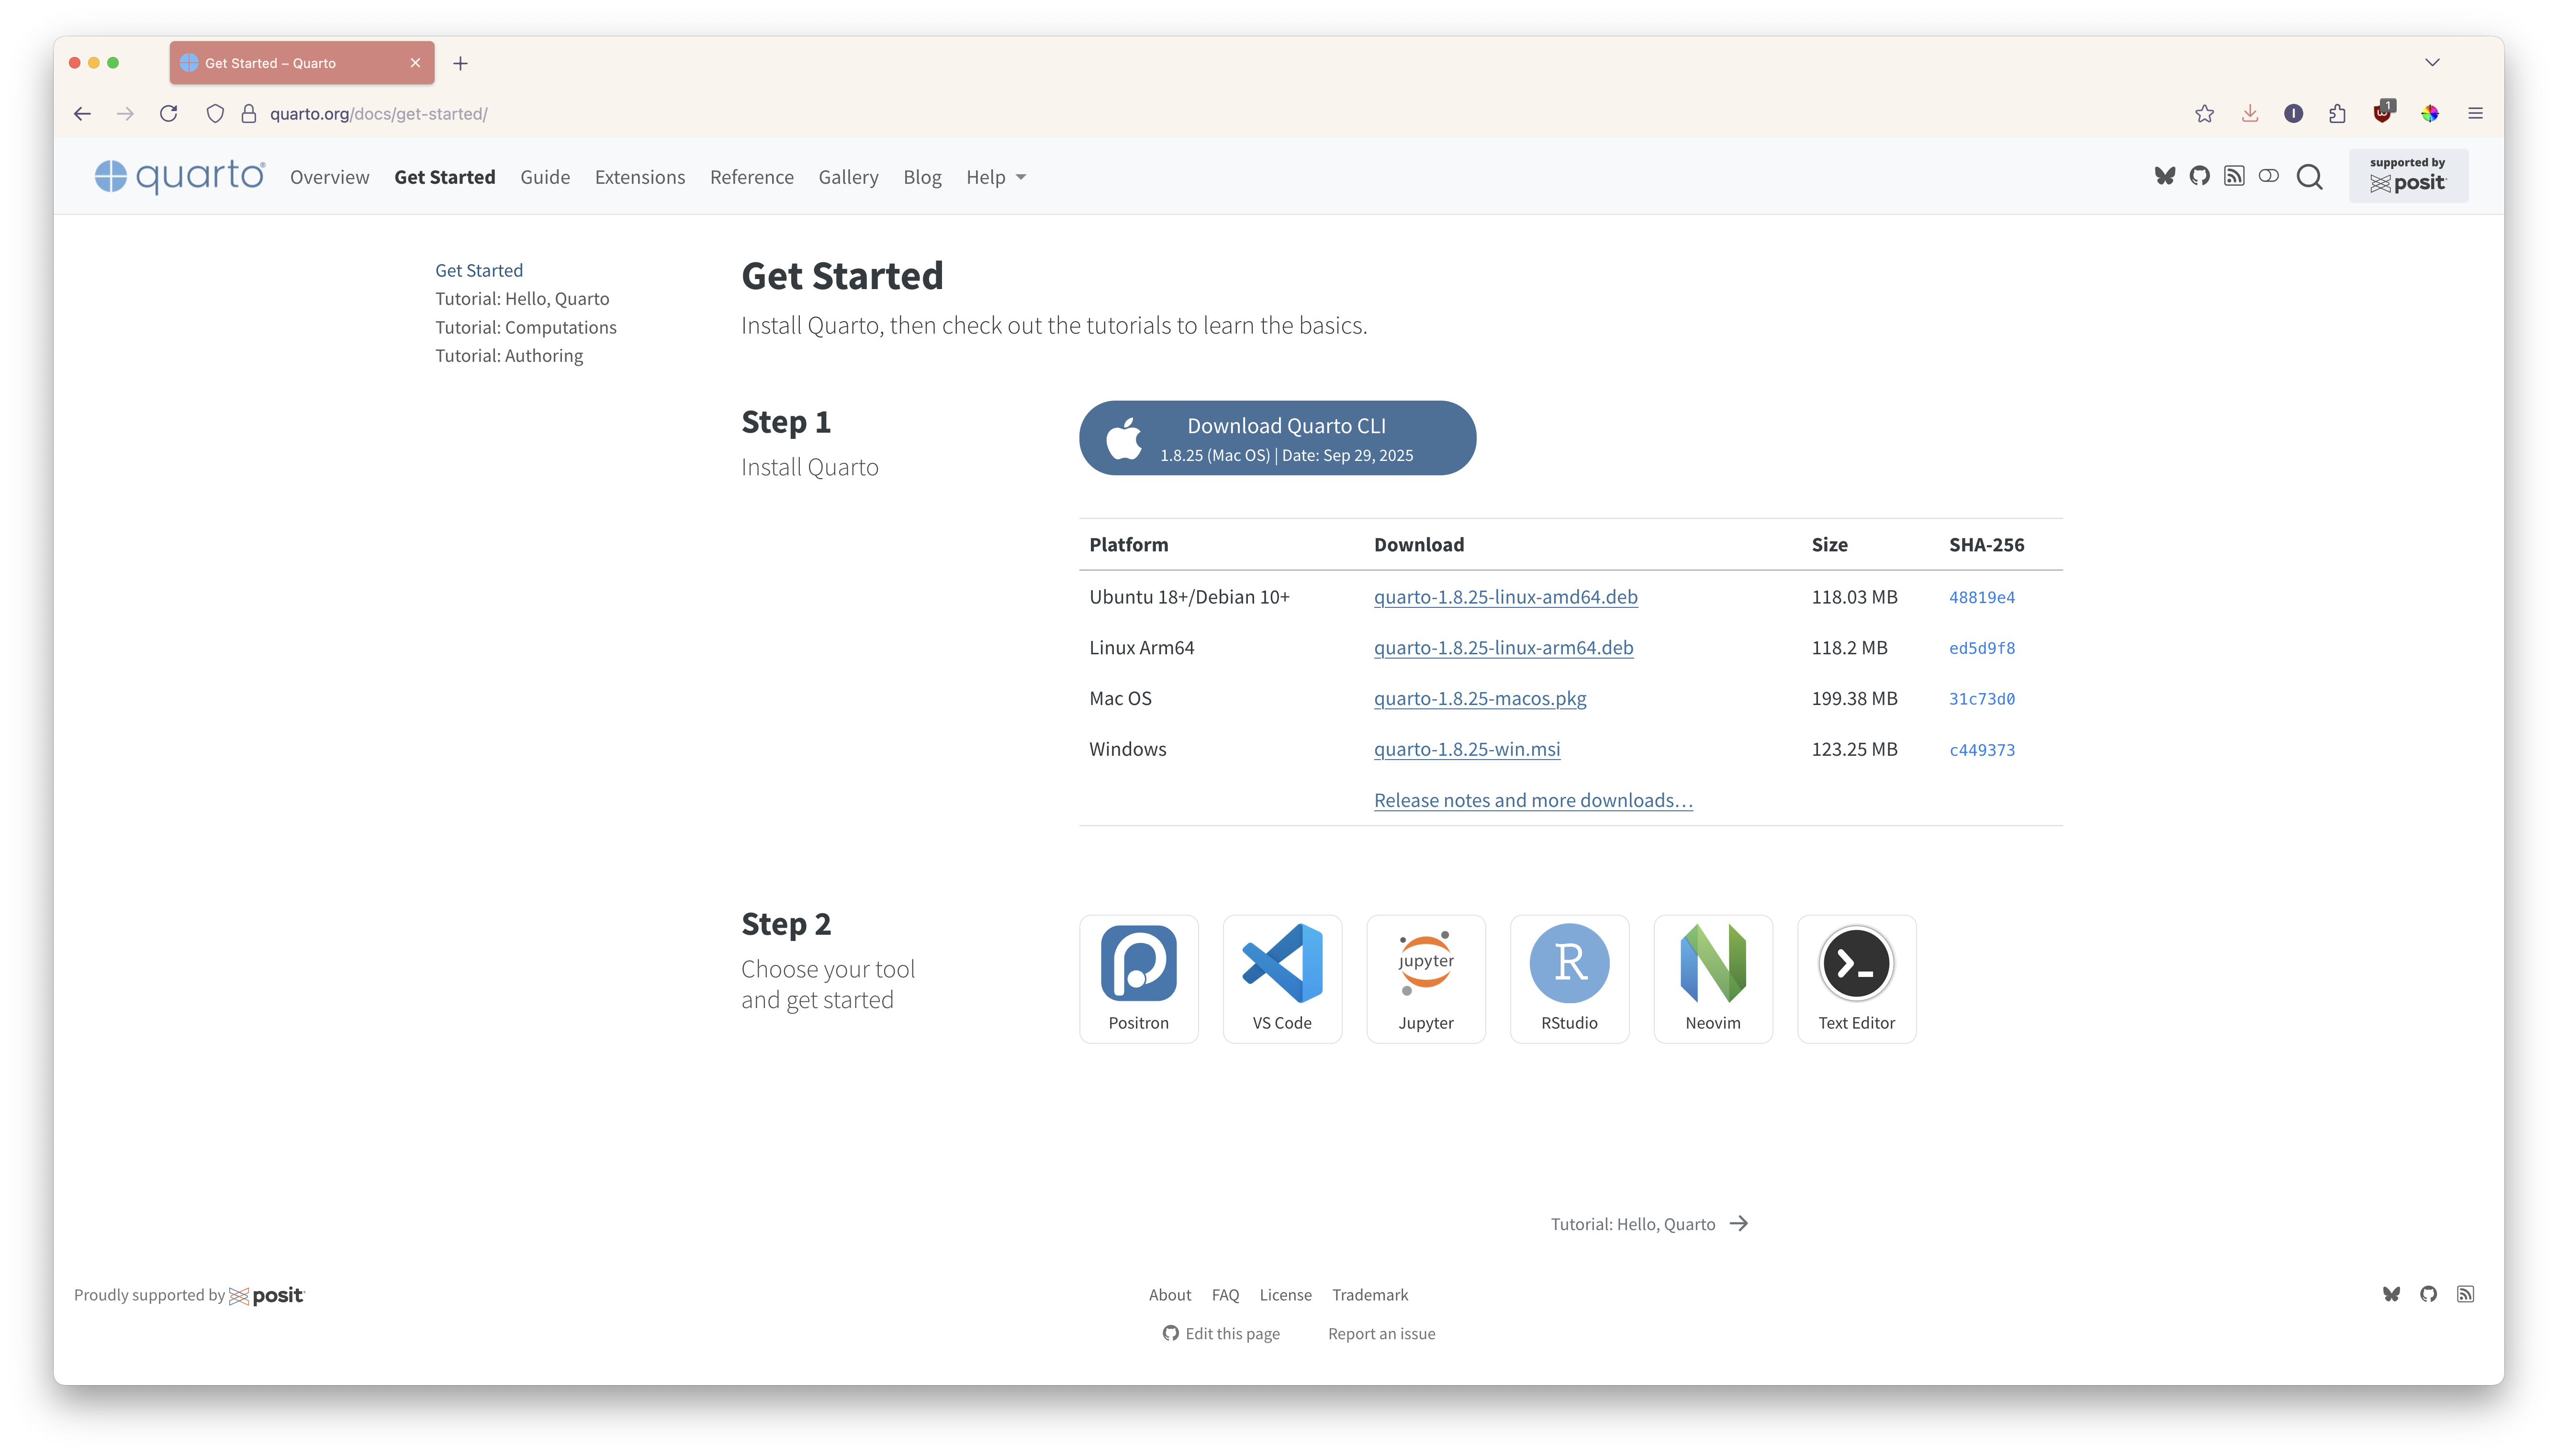
Tools for authoring
![]()
![]()
![]()
![]()
![]()
Creating a new Quarto document
- This file will have a
.qmdextension
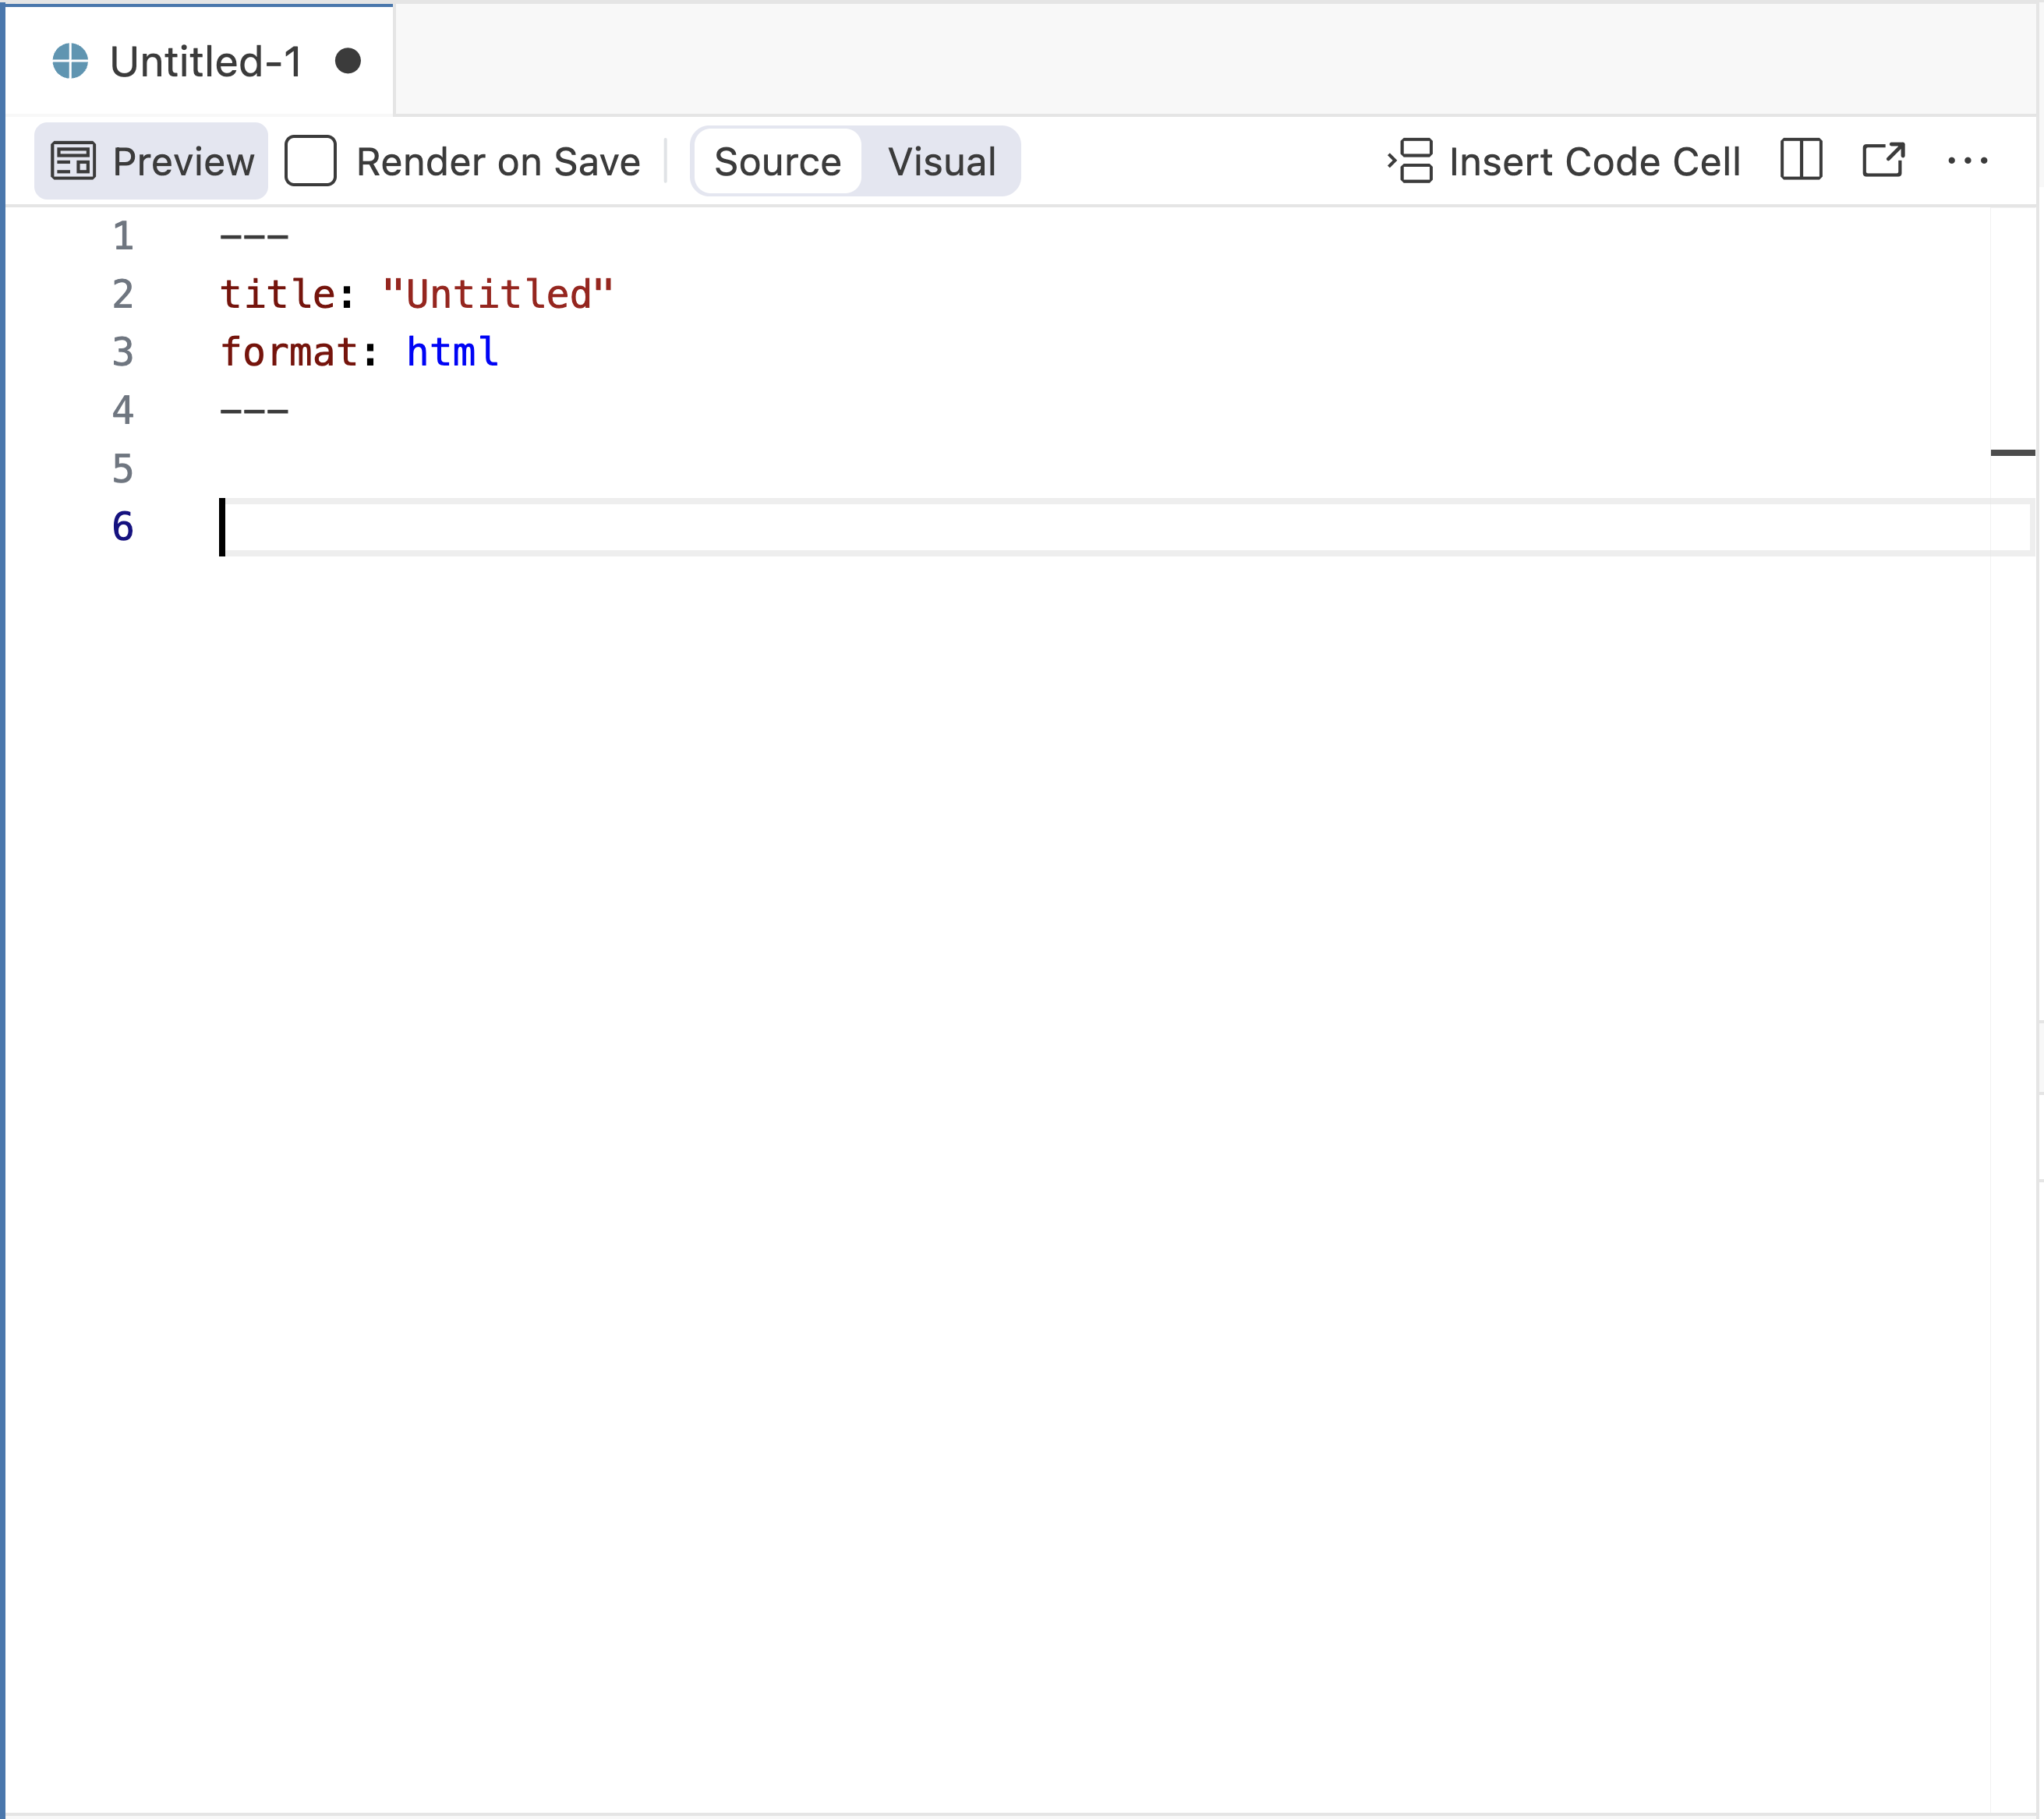
Previewing a Quarto document
Use the Render button (in RStudio) or the Preview button (in Positron or VS Code) to preview documents as you edit them.
- Check off Render on Save to automatically render whenever you save

We are here
Anatomy of a Quarto document
A .qmd file format with three components:
YAML: Metadata
Text: Markdown
Code: R, Python, Observable, and Julia
Weave it all together, and you have beautiful, powerful, and useful outputs!
Anatomy of a Quarto document
Metadata: YAML
Anatomy of a Quarto document
Metadata: YAML
Anatomy of a Quarto document
Text: Markdown
report.qmd
- Markdown is a lightweight language for creating formatted text
- Quarto is based on Pandoc and uses its variation of markdown as its underlying document syntax
Anatomy of a Quarto document
Text: Markdown
| Markdown syntax | Output |
|---|---|
|
italics and bold |
|
superscript2 / subscript2 |
|
|
|
verbatim code |
Anatomy of a Quarto document
Text: Markdown
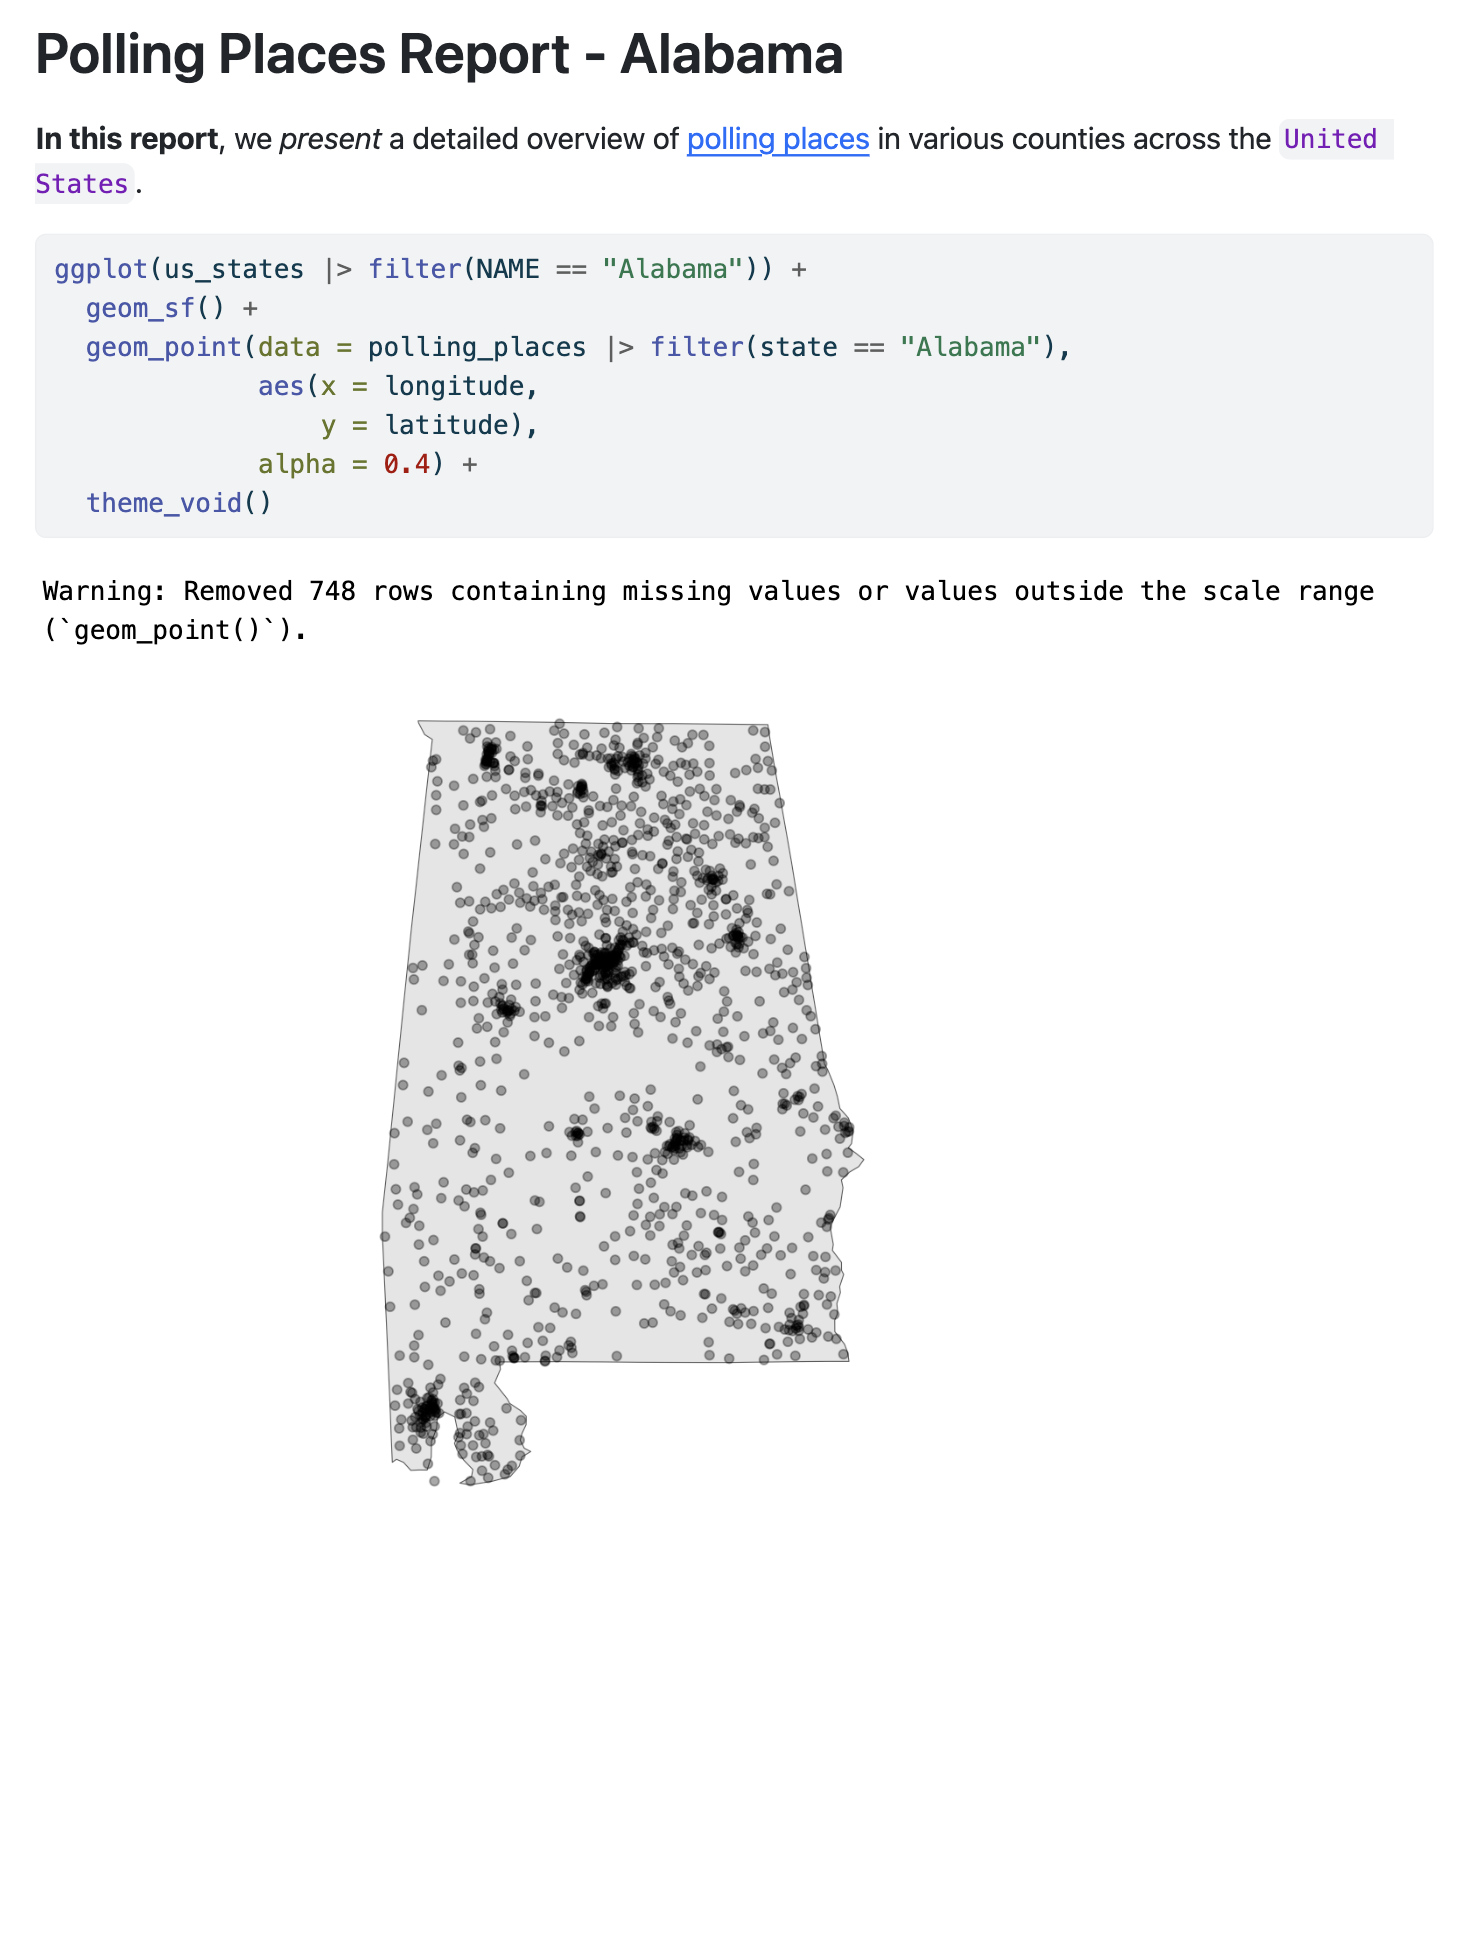
**In this report**, we *present* a detailed overview of
[polling places](https://www.vote.org/polling-place-locator/) in various
counties across the `United States`.
Results in:
In this report, we present a detailed overview of polling places in various counties across the United States.
Anatomy of a Quarto document
Code
report.qmd
---
title: "Polling Places Report - Alabama"
format: html
---
**In this report**, we *present* a detailed overview of [polling places](https://www.vote.org/polling-place-locator/) in various counties across the `United States`.
```{r}
library(tidyverse)
us_states <- states(cb = TRUE, resolution = "20m") |>
filter(NAME != "Puerto Rico")
ggplot(us_states |> filter(NAME == "Alabama")) +
geom_sf() +
geom_point(data = polling_places |> filter(state == "Alabama"),
aes(x = longitude,
y = latitude),
alpha = 0.4) +
theme_void()
```Anatomy of a Quarto document
Code
report.qmd
---
title: "Polling Places Report - Alabama"
format: html
---
**In this report**, we *present* a detailed overview of
[polling places](https://www.vote.org/polling-place-locator/) in various
counties across the `United States`.
```{r}
library(tidyverse)
us_states <- states(cb = TRUE, resolution = "20m") |>
filter(NAME != "Puerto Rico")
ggplot(us_states |> filter(NAME == "Alabama")) +
geom_sf() +
geom_point(data = polling_places |> filter(state == "Alabama"),
aes(x = longitude,
y = latitude),
alpha = 0.4) +
theme_void()
```- Code chunks begin and end with three backticks (usually)
- Code chunks are identified with a programming language in between
{}
Anatomy of a Quarto document
Code
Anatomy of a Quarto document
Code can include optional chunk options, in YAML style, identified by #| at the beginning of the line
| Option | Description |
|---|---|
eval |
Evaluate the code chunk |
echo |
Include the source code |
warning |
Include warnings |
include |
Include code and results |
Other options: https://quarto.org/docs/computations/execution-options.html
Anatomy of a Quarto document
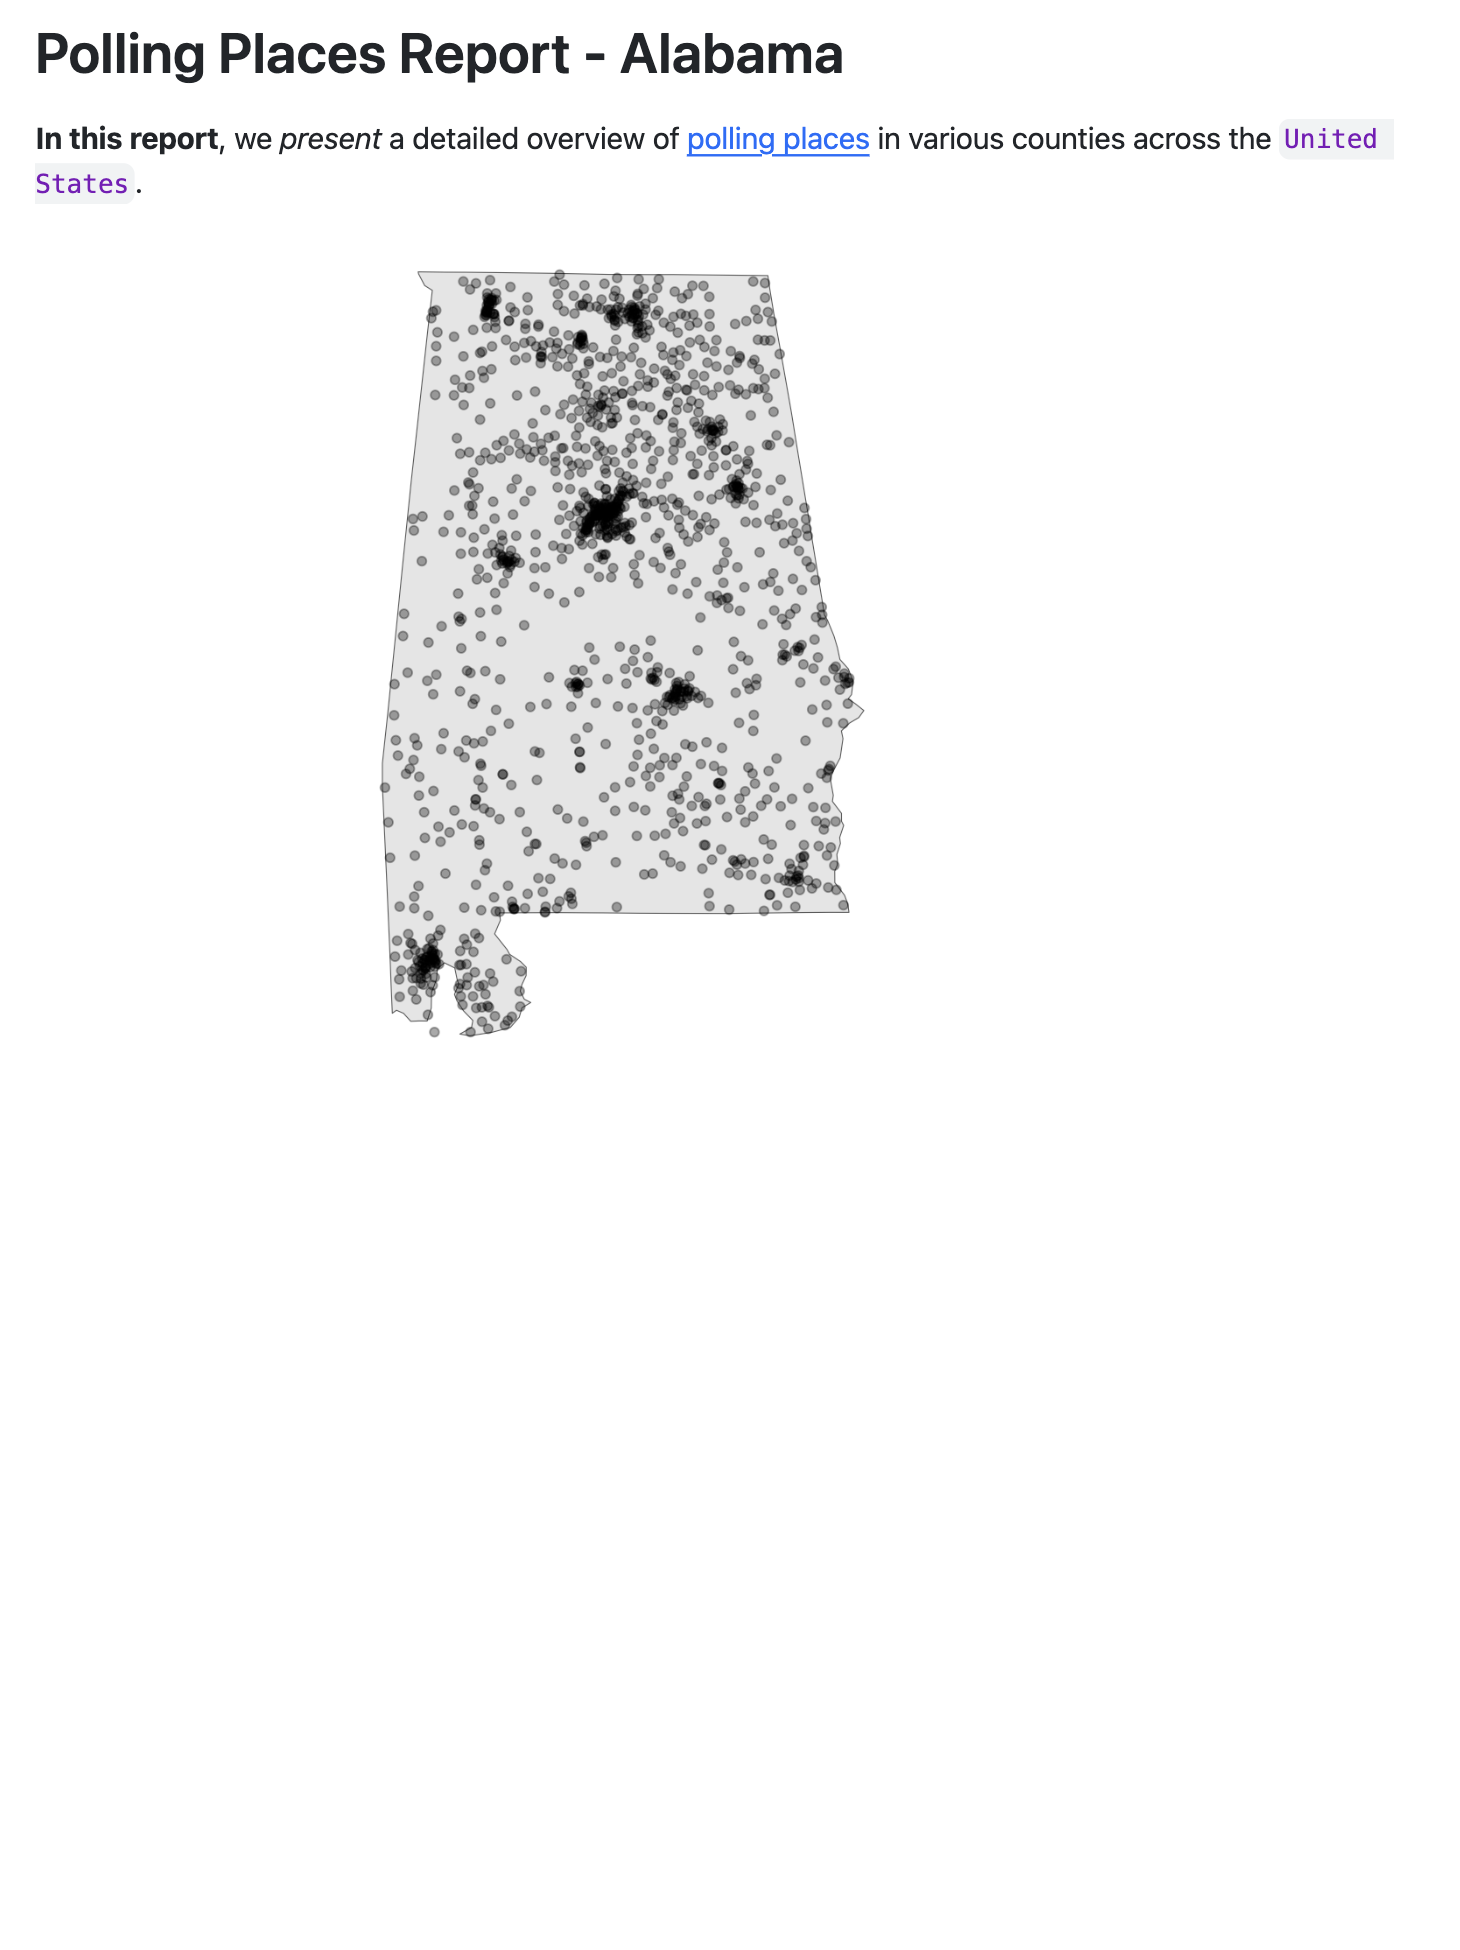
---
title: "Polling Places Report - Alabama"
format: html
---

**In this report**, we *present* a detailed overview of [polling places](https://www.vote.org/polling-place-locator/) in various counties across the `United States`.

```{r}
#| echo: false
#| warning: false
library(tidyverse)

us_states <- states(cb = TRUE, resolution = "20m") |>
  filter(NAME != "Puerto Rico")

ggplot(us_states |> filter(NAME == "Alabama")) +
  geom_sf() +
  geom_point(data = polling_places |> filter(state == "Alabama"),
             aes(x = longitude,
                 y = latitude),
             alpha = 0.4) +
  theme_void()
```Anatomy of a Quarto document
Code
Anatomy of a Quarto document
Inline code executes code within Markdown
Results in:
The number of counties is 1881.
Iterating your reports
Automating Repetitive Reports with Quarto
Overview
What is Quarto?
Getting started
Iterating your reports
Styling your reports
Rendering other formats
Summary
Now we are here
Notice how much we’d have to repeat for each report
- Manually creating tables for Alabama - 65 counties!
- Manually creating tables for every county in every state - 1881 counties!
Let’s automate the county tables using knitr::knit_child()
knitr::knit_child()allows you to break your content into smaller, modular pieces- It involves having a “child” document as a template and running it repeatedly with different parameters
- The “main” document “knits” or includes the output from the child document
Set up the “child” document
Original:
_template.qmd
Set up the “child” document
Child document:
_template.qmd
### {{current_county}} COUNTY

* Total Polling Places: `r polling_places |> filter(state == "Alabama", county_name == "{{current_county}}") |> count()`
* Example Locations:

```{r}
polling_places |>
  filter(state == "Alabama",
         county_name == "{{current_county}}") |>
  head(6) |>
  select(name, address.x) |>
  kbl(format = "markdown")
```Set up the “main” document
report.qmd
```{r}
#| results: hide
counties <- polling_places |>
  filter(state == "Alabama") |>
  distinct(county_name) |>
  pull()

expanded_child <- counties |>
  map(function(county) knitr::knit_expand("../_template.qmd", current_county = county))  |>
  flatten()

parsed_child <- knitr::knit_child(text = unlist(expanded_child))
```

`r parsed_child`Now we’re here
Notice how much we’d have to repeat for each report
- Manually creating documents for every state in the dataset - 39 states!
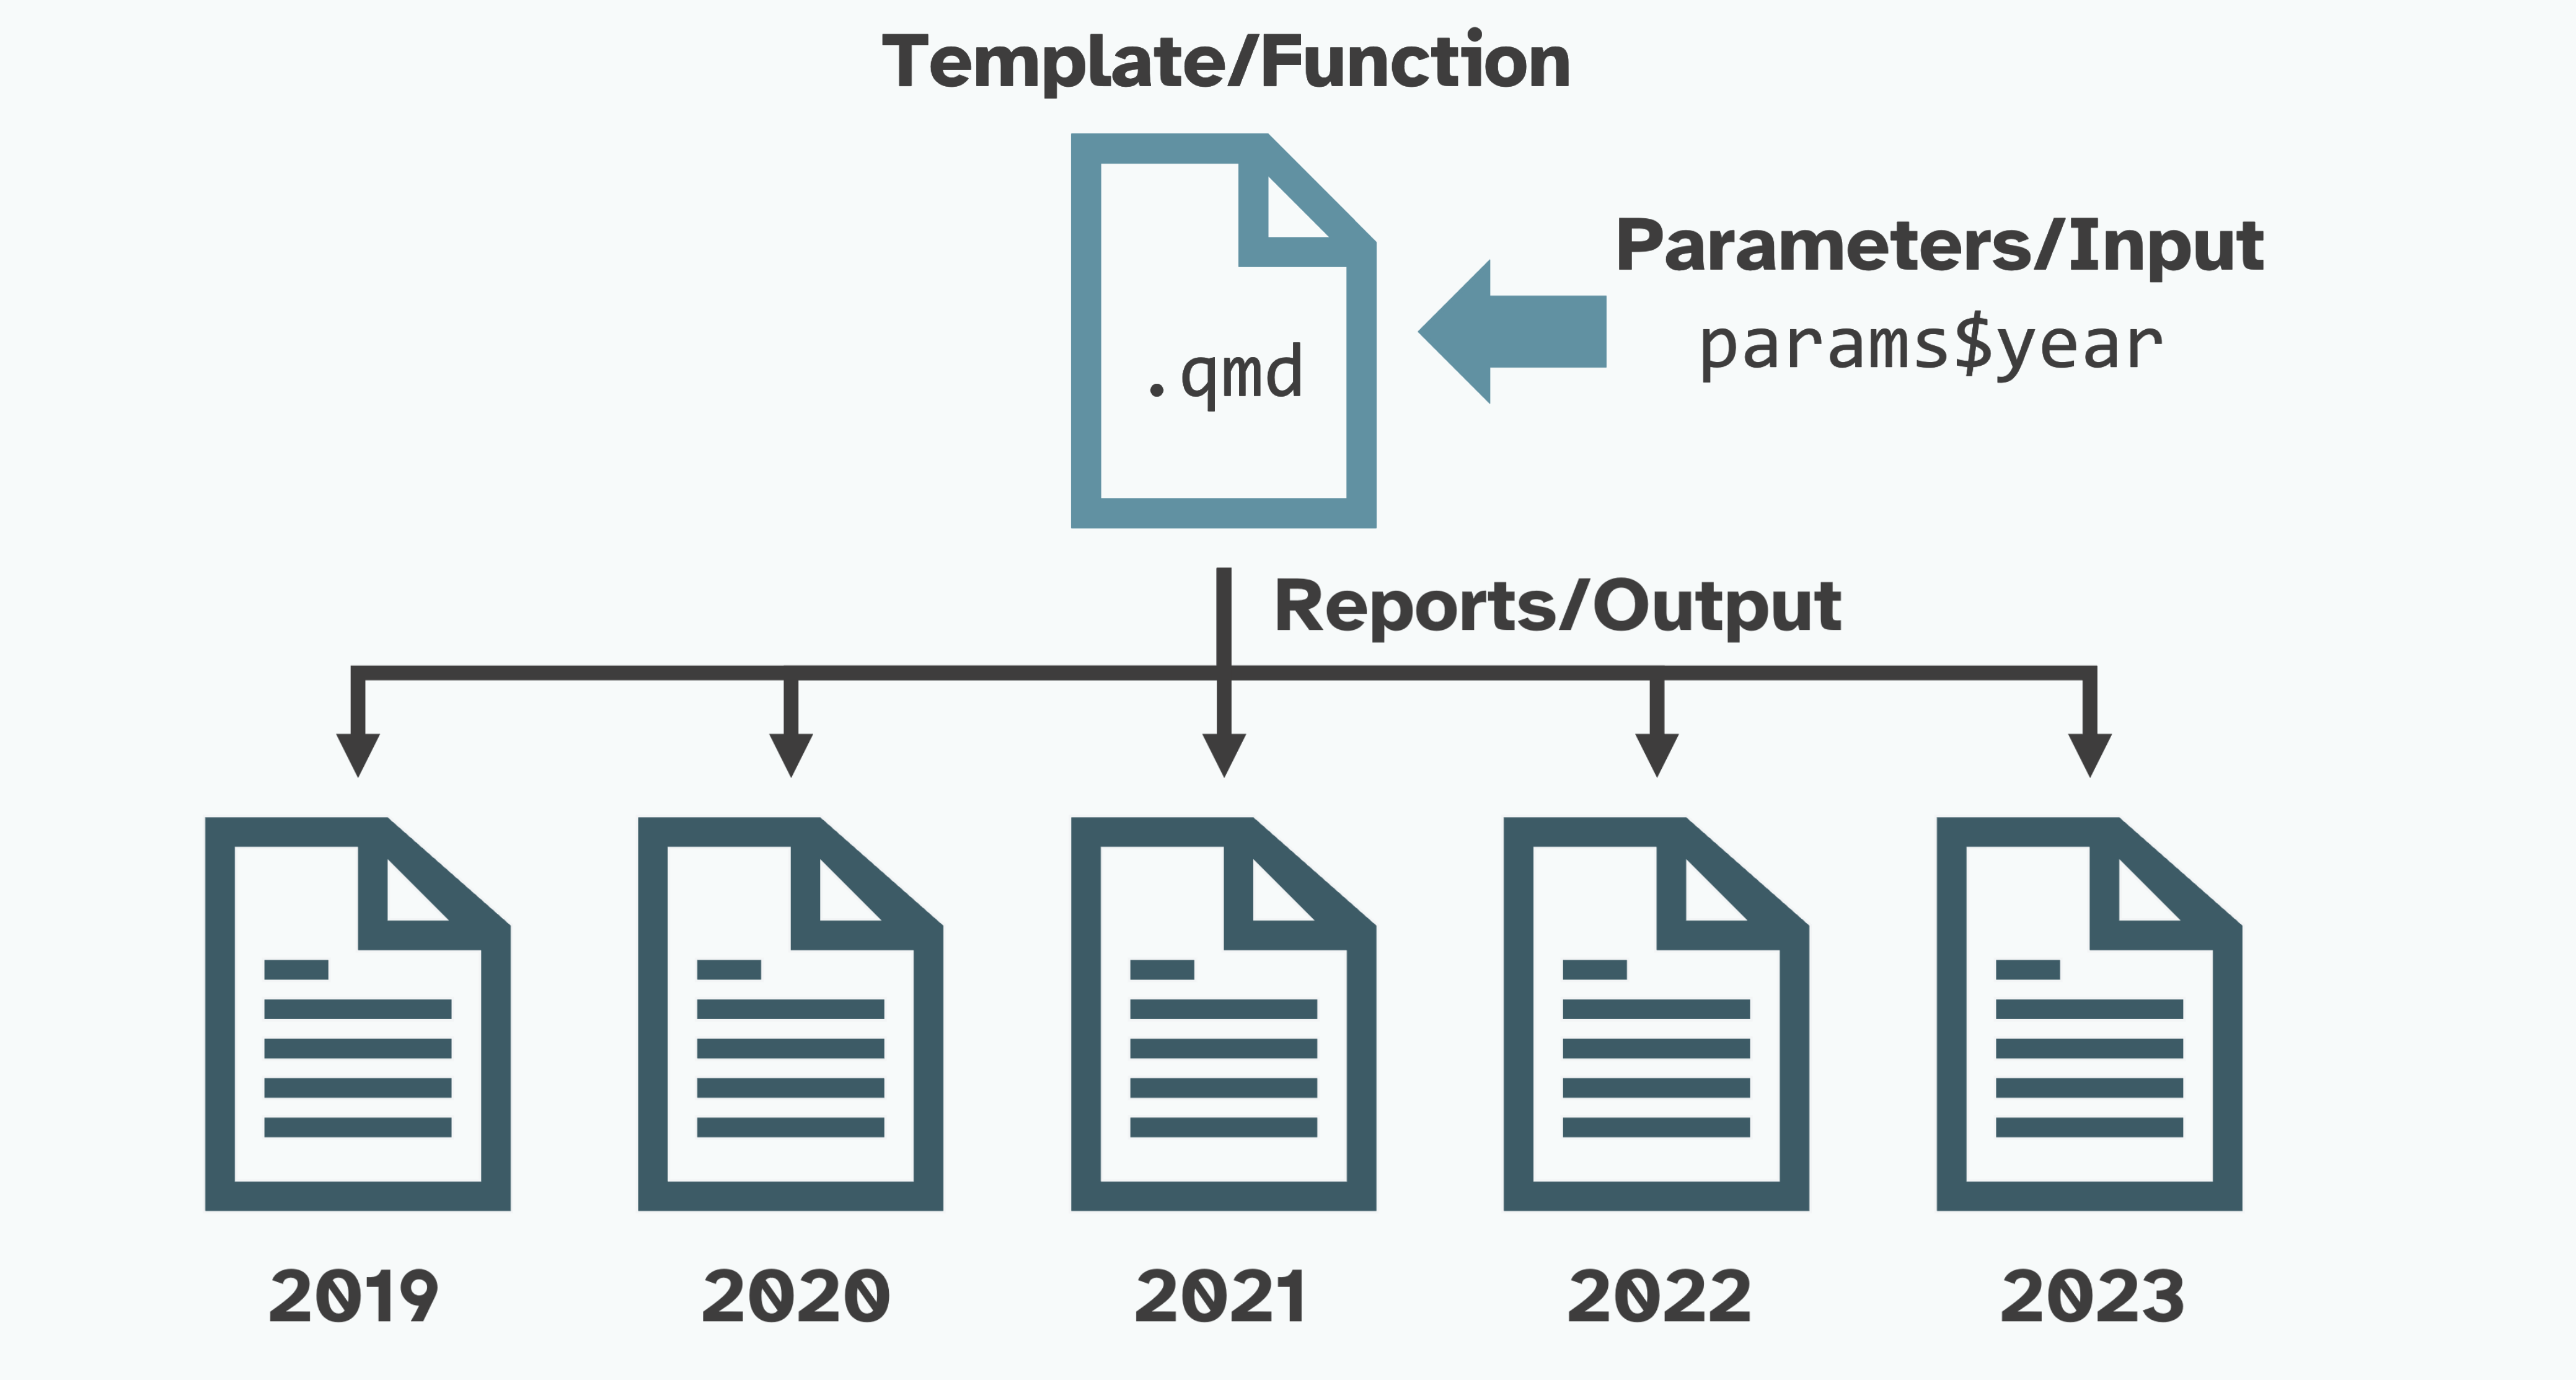
Let’s automate the state reports using parameters
- Parameters refer to variables or values that you can set in the YAML header
- These parameters can be used to specifying values that are used throughout the document
- Using parameters means that we can create copies of the same report for different values by just changing the parameter in the YAML
Let’s automate the state reports using parameters
Parameterized Reporting with Quarto by Jadey Ryan
Edit the YAML header
- Use
paramsin the key:value pair
Replace hard-coded variables with the params variable
- Use the
params$statenotation anytime there’s a hardcoded value
Replace hard-coded variables with the params variable
- Use the
params$statenotation anytime there’s a hardcoded value
Replace hard-coded variables with the params variable
Original:
Replace hard-coded variables with the params variable
Parameterized:
Note
This includes our inline code and child _template.qmd document!
Edit params in the YAML to rerender the report for different states
Render the parameterized document
- Render button in RStudio
- Quarto CLI:
quarto render polling-places-report.qmd -P state:'California' - The quarto R package:
quarto::quarto_render()
Now we’re here
Render all 39 reports
Option 1:
- Change the
paramsfor each state - Render the report
- Change the file name to match the parameter
- Repeat 39 times
Render all 39 reports
Option 2:
- Create a dataframe with columns that match
quarto::quarto_render()
output_format: file type (html, revealjs, pdf, docx, etc.)output_file: file name with extensionexecute_params: named list of parameters
- Map over each row:
purrr::pwalk(dataframe, quarto_render, quarto_render_args)
Create the dataframe to iterate over
_parameters_render.R
library(readr)
library(dplyr)
library(quarto)

polling_places <-
  readr::read_csv(here::here("data", "geocoded_polling_places.csv"))

polling_places_reports <-
  polling_places |>
  dplyr::distinct(state) |>
  dplyr::slice_head(n = 5) |>
  dplyr::mutate(
    output_format = "html",
    output_file = paste0(
      tolower(state),
      "-polling-places.html"),
    execute_params = purrr::map(
      state,
      \(state) list(state = state))) |>
  dplyr::select(output_file, execute_params)
Map over each row
Styling your reports
Automating Repetitive Reports with Quarto
Overview
What is Quarto?
Getting started
Iterating your reports
Styling your reports
Rendering other formats
Summary
Add a Bootswatch theme
- Quarto includes 25 themes from the Bootswatch project
- In the YAML, add an included theme using
themeunderhtml
Use extensions
- Extensions are a powerful way to modify and extend Quarto
- The Quarto Extensions Gallery has an extensive list of available extensions
- For example, install and use the
sketchy quartoextension
Use custom themes
- Add an
.cssor.scss(Syntactically Awesome Style Sheets) file to your project - Include it in the YAML to use in your report
/*-- scss:defaults --*/
@import url('https://fonts.googleapis.com/css2?family=Fraunces:opsz@9..144&family=Gilda+Display&display=swap');
$font-family-sans-serif: "Fraunces", sans-serif;
$presentation-heading-color: #446571;
$code-block-font-size: 0.6em;
$code-color: #5f5f5f;
$presentation-h2-font-size: 1.4em;
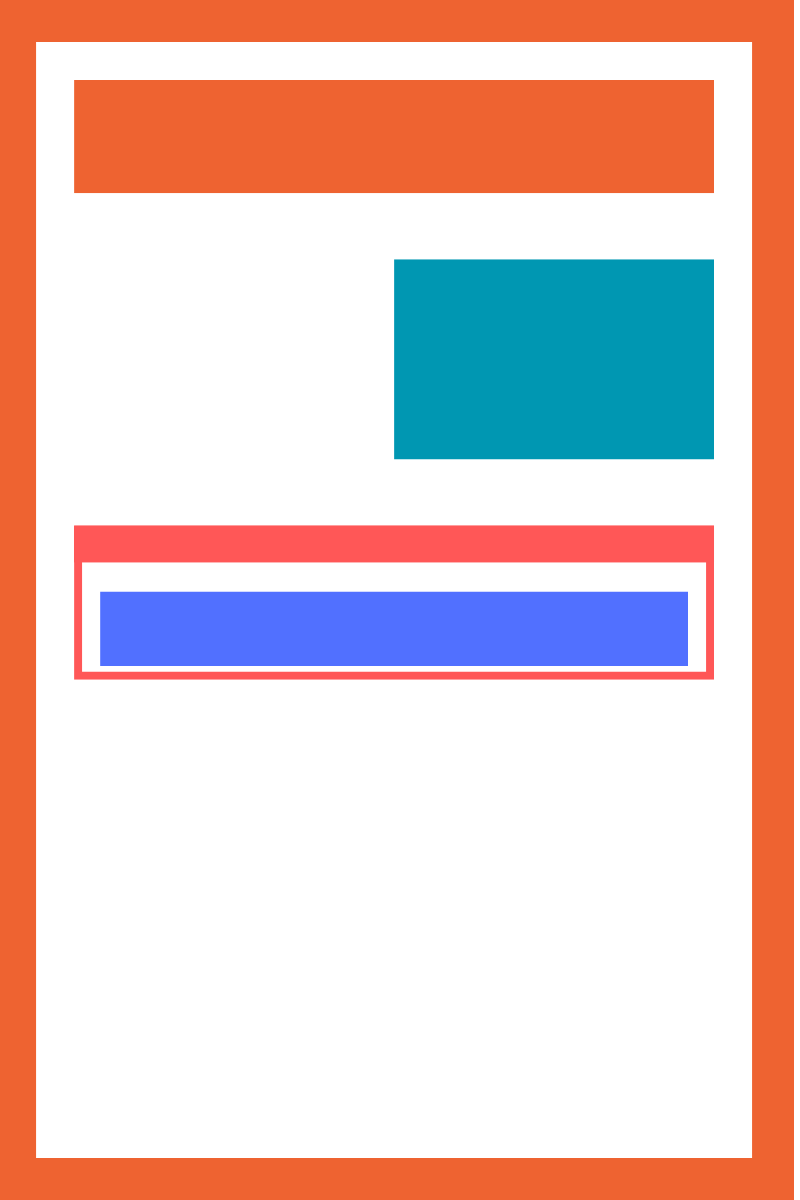
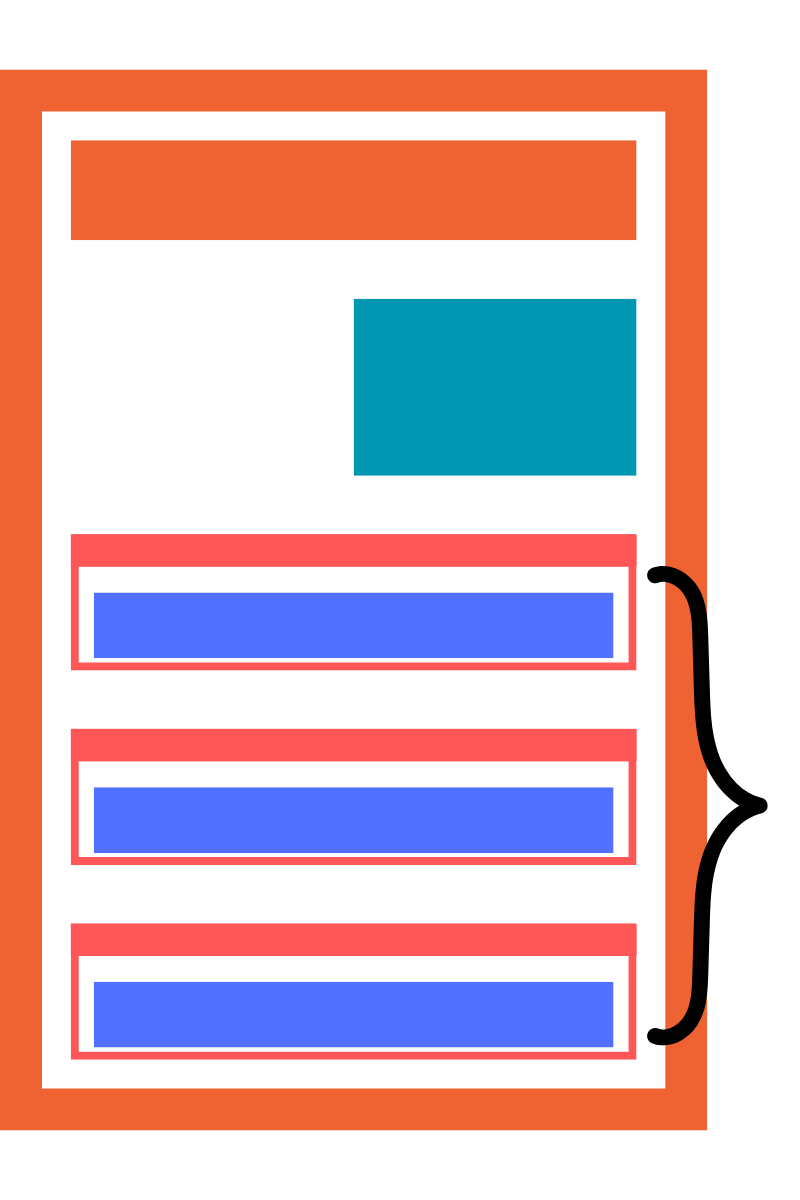
$link-color: #446571 !default;Add a title banner
- Include a formatted title block at the start of the report
- Add to the YAML using
title-block-banner
Rendering other formats
Automating Repetitive Reports with Quarto
Overview
What is Quarto?
Getting started
Iterating your reports
Styling your reports
Rendering other formats
Summary
Add other formats to the YAML
- Quarto can render multiple formats from the same document
- For example, add
pdfto the YAML to render both HTML and PDF versions of the report
Summary
Automating Repetitive Reports with Quarto
Overview
What is Quarto?
Getting started
Iterating your reports
Styling your reports
Rendering other formats
Summary
In summary
- You can automate chunks of your reports using
knit_child() - You can automate the same report with different inputs using parameters
- You can avoid a lot of headaches with Quarto
Thank you!
I hope that you enjoyed automating reports using Quarto! I’d love to see what you create:
ivelasq-automating-quarto.share.connect.posit.cloud